To display an historical comparison of call scenarios:
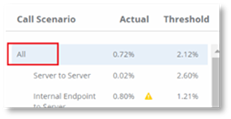
1. Select All Poor Calls KPI.

2. Select All.

3. Select
 .
.

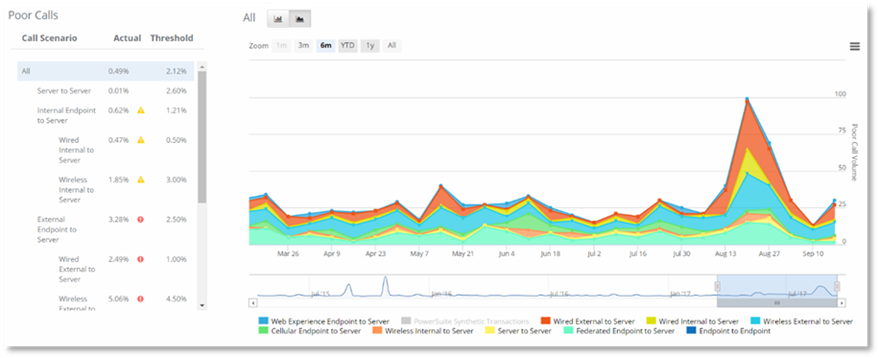
4. A call scenario comparison chart will be displayed, showing the Poor Call volume for each scenario.
NOTE:
The poor call volume is the number of poor calls for the scenario.

The following scenarios enabling you to compare the scenarios are displayed in the chart by default for Skype for Business,
- Web Experience Endpoint to Server
- Federated Endpoint to Server
The following scenarios enabling you to compare the scenarios are displayed in the chart by default for Microsoft Teams or Skype for Business Online:
The scenarios can be added or removed from the chart by selecting the scenario in the key below the chart.
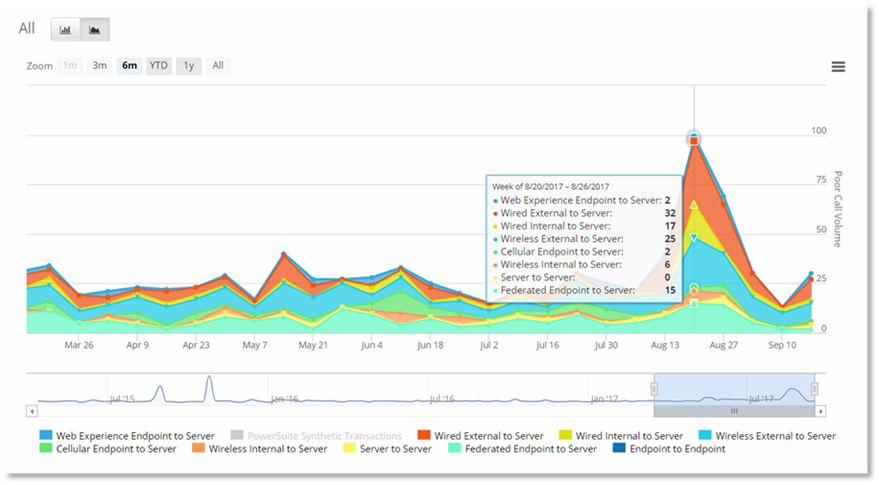
Select a data point on the chart to view the number of poor calls for each scenario.
