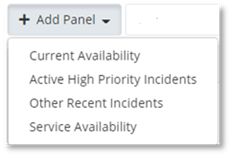
The following charts or tables can be displayed in the Monitoring dashboard using the Add Panel drop down menu:
- Active High Priority Incidents
Using the Add Panel drop down menu, select the chart you wish displayed in the dashboard. Multiple instances of the same panel can be added: for example, multiple Service Availability charts. To display the default PowerSuite Monitoring dashboard layout. Select the Default Layout tab.
