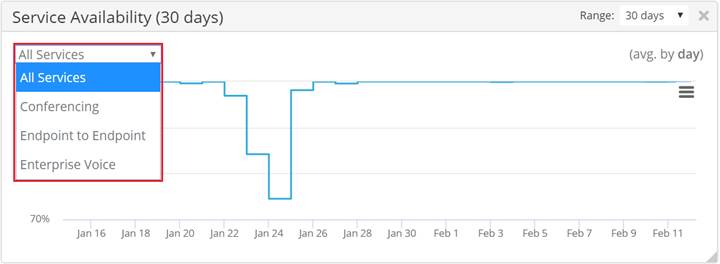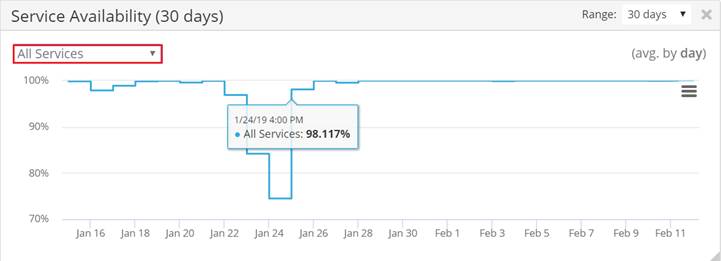
PowerSuite’s Monitoring Solution validates Skype for Business deployments, by replicating end user scenarios, and identifying the true impact of any failures to the end users. It is therefore important to understand the end user scenarios that are available. The Service Availability chart, in the PowerSuite Monitoring dashboard displays the historical availability percentage, broken down by call scenario.
The Service Availability charts enable:
- Improvements to be viewed over time.
- Understanding where potentially there was a significant degradation in overall availability.
The default scenario displayed in the chart is All Services. Click on the arrow adjacent to the scenario to view and change to another scenario.