is
blue in the Timeline column, click on to display the Timeline chart displaying
the in-call data.
is
blue in the Timeline column, click on to display the Timeline chart displaying
the in-call data.
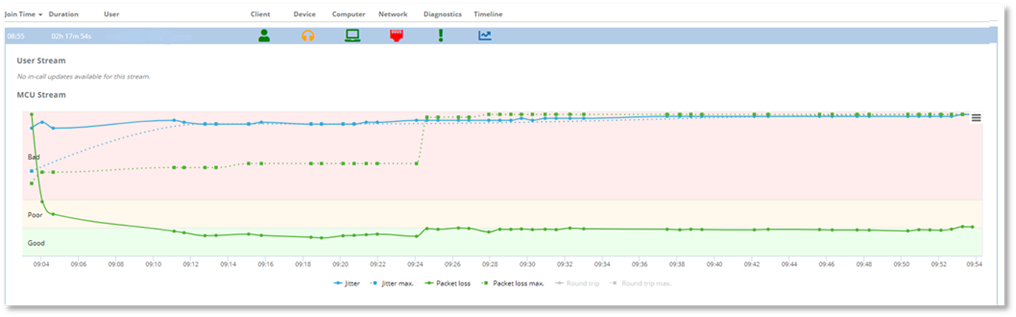
The Timeline column displays whether in-call network data has been collected during a call or conference for both MCU and User Stream. Data points are displayed on the chart when a change occurred. The following network data is presented in the chart:
- Avg. Packet Loss
- Max. Packet Loss
- Avg. Jitter
- Max. Jitter
When is
blue in the Timeline column, click on to display the Timeline chart displaying
the in-call data.
NOTE:
The Timeline icon is grayed  when there is no in-call data to
display.
when there is no in-call data to
display.
Example:
No in-call data is displayed if the call audio was good, or if the client that was used does not support in-call data collection.
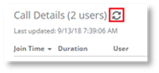
If you are viewing a call that is in-progress, the timeline
information displayed for the selected user will automatically update. This
automatic update of data is unique to the timeline in-call data, all other call
or conference details data will not be updated to reflect new or changed
information in the call or conference. To update the remaining Call Details data
click  to refresh the
page.
to refresh the
page.
The in-call data points displayed in the timeline chart display the maximum and average data that has been collected from the beginning of the call. The maximum values are displayed as data points connected via dotted lines. Maximum value data points are only displayed if the maximum value increases. The average values are displayed as solid lines connecting all average data points in the chart.
Example
A user experiences high jitter at the beginning of the call, and the jitter reduces after a few minutes. The average jitter solid line displayed in the chart will change based on the average jitter level increasing and decreasing throughout the call. The maximum jitter dotted line will however never drop below the maximum jitter that has been experienced at any point during the call by the user, even if the user is no longer experiencing any jitter.
NOTE:
Data collected for in-call updates are based on the entire length of the call, therefore the Average and Maximum metrics are calculated on the entire length of the call.
The example screenshot below shows:
- The maximum packet loss occurred at 09:24. The value stays at this maximum level throughout the remainder of the chart, even if the packet loss value in the call decreases.
- The average packet loss increased after 09.24 due to the packet loss occurring at that time.