The PowerSuite KPIs are:
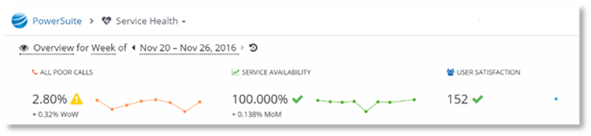
All Poor Calls:
All poor calls is a measure that represents the quality of calls within your environment. CDR and QOE data is gathered and represented in the chart according to Microsoft’s categorization of calls as either good or poor. Information on the Microsoft metrics that are used to determine the quality rating of a call, can be found at this Inside Skype for Business blog post.
NOTE:
The only PowerSuite KPI displayed for Microsoft Teams and Skype for Business Online is all poor calls.
Service Availability:
The service availability measure represents the availability of your Skype for Business service, as experienced by the users of the service. Service availability is measured by PowerSuite’s automated monitoring, which simulates user interactions at regular intervals to ensure that the environment is available and responsive.
User Satisfaction:
The user satisfaction measure displays the users’ satisfaction with the Skype for Business service. A long-running user survey asks a statistically significant portion of the selected user population to rate on a scale of 1-4, how happy they are with Skype for Business. The user satisfaction value presented, is an index of the NSAT scores displaying a week over week or month over month trend for the user survey. Higher numbers indicate more satisfied users.
|
NSAT SCORE | |
|
Below 120 |
Requires review and analysis |
|
120-129 |
Needs analysis |
|
130 - 139 |
Good |
|
140 - 149 |
Very good |
|
150+ |
Excellent |
NOTE:
Service availability and user satisfaction are only displayed in the PowerSuite Skype for Business pages, they are not displayed in the PowerSuite Microsoft Teams or Skype for Business Online pages.