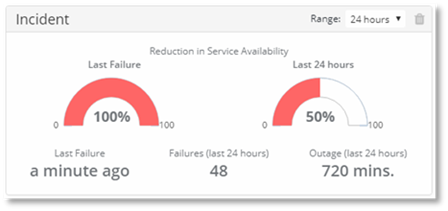
The Incident chart displays:
- The total outage duration during the selected time range
- The percentage of users that were affected were affected by the outage
- The last failure.
- The number of scenario failures during the time period that were detected.