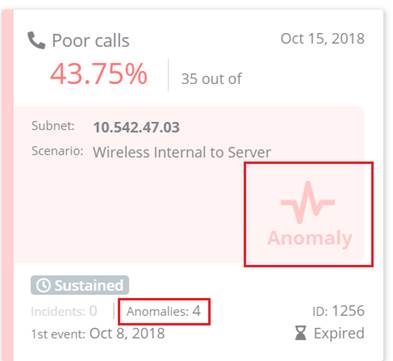
The Poor Calls problem tile displays:
- Poor Call Percentage
o Displays the percentage of poor calls for the entity detailed in the tile, based on the number of poor calls out of the total number of calls.
- Scenario
o The name of the poor call scenario.
- Number of Poor calls
o The number of poor calls.
- Last Event Occurrence
o When the last event occurred.
- Incidents
o The number of incidents for this problem.
- Anomalies
o The number of anomalies for this problem.
- Problem ID number
o The Problem ID number is automatically assigned by PowerSuite. Example: 8489.
- Problem Status
o The status that the problem has been assigned.
•New
- Anomalies
o Anomalies pinpoint sudden changes of the monitored metrics. Anomalies enable you to detect shorter value spikes in the monitored metric, even though the average period metric values are within the norm. Whenever spikes in the metric occur that may require attention, an event is fired.
o When anomalies are present, the Anomaly symbol will display when the last event was an anomaly.
- Sustained
o The Sustained tag shows that
the problem is not intermittent; it has been observed over subsequent
periods.
- 1st Event
o The first problem event that occurred.
Click anywhere on the poor call problem tile to open the details view to display further information, add information or change the status of the problem.