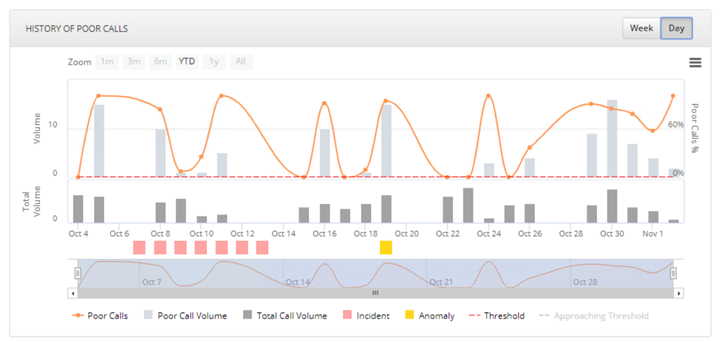
The Events tab marks each incident with a number on the chart displaying the Poor Calls history. Hover over the chart in the Events tab to view:
- Incident
- Anomaly
The data can be displayed by the week or day. Use the button at the top right of the chart to select day or Week.